


What do ADU cap rates actually look like in California?
California ADU cap rates typically vary widely depending on location, construction cost, and expense assumptions, with coastal markets generally lower due to high prices and inland markets higher due to lower land and construction costs.
Here is a quick snapshot of how ADU size, cost, and rent translate into cap rates across representative California markets:
- Small ADU in Los Angeles typically involves moderate build costs and rents leading to mid-range cap rates.
- Mid-size ADU in Sacramento shows more favorable cap rates due to lower costs.
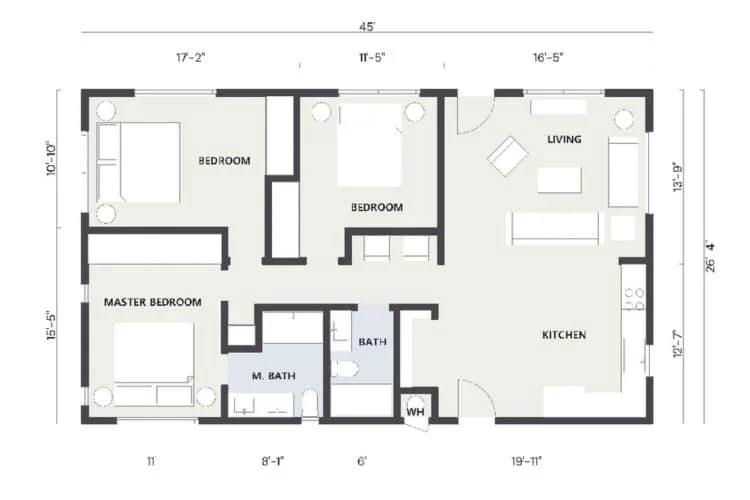
- A larger detached ADU has different build costs and potential rental income from a compact conversion, so compare each layout using its own budget and local rental comparables.
- Garage conversions in Bay Area reflect higher costs and rents with generally lower cap rates.
Build costs, rents, and cap rates for ADUs vary by city, with Los Angeles and Bay Area typically having higher costs and lower cap rates (3%–5%), while inland areas like Fresno can see higher cap rates up to 8%, depending on costs and rents.
Cap rates vary by market and should be considered alongside factors like property appreciation and market demand, as numbers alone do not capture all investment risks and opportunities.
How to measure ADU rental income potential and calculate cap rate
Cap rate starts with net operating income (NOI), not gross rent. Getting that calculation right is where most homeowners stumble.
Step-by-step NOI calculation for an ADU:
- Estimate gross potential income (GPI): Multiply expected monthly rent by 12. A $2,000/month ADU produces $24,000 GPI annually.
- Subtract vacancy allowance: Apply a realistic vacancy rate of 3%–5% for high-demand Southern California markets. On $24,000 GPI, a 4% vacancy deducts $960, leaving $23,040 effective gross income.
- Subtract operating expenses: Include property taxes, insurance, maintenance reserves, property management fees, and any HOA or utility costs. A reasonable expense ratio for a California ADU runs 35%–45% of effective gross income.
- Arrive at NOI: Effective gross income minus total operating expenses.
- Divide NOI by property value (or total project cost): Cap rate = NOI ÷ value.
Key variables that shift your result:
- Vacancy rate: Even moving from 4% to 8% vacancy can drop your cap rate by half a point or more.
- Maintenance reserves: Budget at least 1% of build cost annually. On a $240,000 ADU, that is $2,400 per year.
- Property tax increases: Adding an ADU can trigger a partial reassessment in California under Proposition 13 rules. Check with your county assessor.
- Management fees: Self-managing saves money; hiring a property manager typically costs 8%–12% of collected rent.
- Lease type: Long-term leases produce stable, predictable income. Short-term rentals can generate higher gross figures but carry management fees of 20%–30% and regulatory exposure in many California cities.
Pro Tip: Run your NOI calculation twice: once with your best-case rent and 4% vacancy, and once with rent 10% lower and 8% vacancy. If the conservative version still pencils out, you have a real investment.
What do real California ADU investment scenarios look like?
A Costa Mesa duplex-plus-ADU example puts the math in sharp relief. Take a property purchased at $1,200,000 with a potential gross income of $96,000 annually across both units. Apply a 4% vacancy rate and operating expenses at 38% of effective gross income, and the NOI lands at approximately $57,059. Divide that by the purchase price, and you get a 4.8% cap rate, which is a reasonable result for coastal Orange County.
Now add financing. A 75% loan-to-value mortgage at 6.5% interest generates annual debt service of roughly $68,454. Subtract that from the $57,059 NOI, and cash flow turns negative at approximately -$11,395 per year, producing a cash-on-cash return of -3.4%. The property is not losing money in an economic sense, but it is not putting cash in your pocket each month either.
Scenario analysis shows that with no financing the cap rate equals the cash-on-cash return, but financing with typical terms can reduce cash-on-cash return below zero despite a solid NOI.
Key assumptions behind these scenarios:
- Gross income includes both duplex units and the ADU combined
- Operating expenses cover taxes, insurance, maintenance, and management
- No short-term rental premium is assumed; income reflects market-rate long-term leases
- Debt service is calculated on a 30-year amortization schedule
The gap between a 4.8% cap rate and a -3.4% cash-on-cash return is entirely explained by the cost of debt. That is why cap rate is an unleveraged metric: it tells you how the asset performs on its own, not how your bank account performs after the mortgage payment clears.
ADU rents, construction costs, and property value across California
Los Angeles ADU construction costs run $180,000 to $350,000 for units in the 450–800 sq ft range, with monthly rents between $1,800 and $3,200. The math on a mid-range build, roughly $240,000 in cost producing $2,400 per month in rent, works out to a gross yield around 12% before expenses. After you account for vacancy, taxes, insurance, and maintenance, net yield drops considerably, which is where the 3%–5% cap rate range for Los Angeles comes from.

Homes with legal ADUs in Los Angeles sell for 20%–30% more than comparable homes without them. That appreciation effect matters for investors who plan to hold and eventually sell, since the ADU adds value beyond its rental income stream. Payback periods typically run 7–12 years depending on construction cost and actual rent collected.
| Region | Avg. Build Cost | Monthly Rent Range | Property Value Lift | Typical Cap Rate |
|---|---|---|---|---|
| Los Angeles | $180,000–$350,000 | $1,800–$3,200 | 20%–30% | 3%–5% |
| Diamond Bar / Pomona project | Obtain project bids | Check current local comparables | Obtain a property-specific appraisal | Calculate from verified income and value |
| Bay Area | $180,000–$350,000 | $1,800–$3,200 | 15%–20% | 3%–5% |
| Sacramento | , | , | 10%–20% | , |
| Fresno / Central Valley | , | , | 8%–15% | 6%–8% |
Understanding ADU construction costs per square foot is the first step toward building a cap rate model you can actually trust. Advertised build prices rarely include permit fees, impact fees, utility connections, or design costs. Budget for all of it before you run your numbers.
Due diligence checklist and common pitfalls for California ADU investments
Most ADU investment mistakes happen before construction starts, not after. Skipping one item on this checklist can flip a profitable project into a break-even one.
Due diligence checklist:
- Confirm local ADU zoning rules and setback requirements with your city or county planning department
- Verify whether your property is subject to local rent control ordinances, which can cap annual rent increases
- Get firm bids from at least three licensed contractors, not just online cost estimators
- Check whether your municipality charges impact fees, which can add thousands to project cost
- Confirm utility connection requirements, including separate meters if required
- Model property tax impact with your county assessor before breaking ground
- Verify financing terms and confirm the loan product fits your timeline and cash flow needs
- Research comparable rents for similar units within a half-mile radius, not citywide averages
Common pitfalls to avoid:
- Underestimating vacancy: A 0% vacancy assumption is not a model, it is wishful thinking. Use 4%–8% for a realistic baseline.
- Ignoring maintenance reserves: Deferred maintenance on a rental unit compounds fast. Budget for it from day one.
- Relying on short-term rental income projections: Cities like Los Angeles, Santa Monica, and San Francisco have strict short-term rental regulations that can eliminate this income stream entirely.
- Using advertised build costs as your budget: Permit fees, design costs, and site conditions routinely push final costs 15%–25% above initial quotes.
- Forgetting insurance increases: Adding a rental unit changes your homeowner’s insurance profile. Get a revised quote before you finalize your NOI model.
- Overlooking rent control exposure: California’s AB 1482 limits annual rent increases for many units. Know whether your ADU qualifies for exemptions.
Pro Tip: Model three scenarios before committing: best case, base case, and a conservative case with rent 10% below market, vacancy at 8%, and construction cost 20% over budget. If the conservative case still works, proceed with confidence.
The risks of ADU investment in California go beyond construction delays. Regulatory changes, financing shifts, and local rental market softness can all affect returns in ways that a simple cap rate calculation will not capture.
Expert tips for building a more accurate California ADU investment model
Simple rent-minus-mortgage math is the most common mistake California ADU investors make. It ignores property tax increases, insurance adjustments, and the ongoing maintenance costs that erode net income every year. A property that looks profitable on a napkin can look very different once you build a proper NOI model.
Experts consistently recommend these practices for more reliable projections:
- Include all ownership costs in NOI: Property taxes, insurance, maintenance, management fees, and reserves all belong in the expense column, not as afterthoughts.
- Separate cap rate from cash-on-cash return: Cap rate measures asset performance without debt. Cash-on-cash return measures what you actually pocket after debt service. Both numbers matter, and confusing them leads to bad decisions.
- Run a long-term lease scenario first: Before you model short-term rental income, build your base case on stable long-term lease assumptions. Short-term rentals carry management fees, regulatory risk, and occupancy volatility that basic cap rate math does not reflect.
- Test multiple financing structures: A lower down payment improves your cash-on-cash return in a low-rate environment but can destroy it when rates are elevated. Model the actual loan terms you qualify for, not the best-case scenario.
- Revisit assumptions annually: Rent markets shift, insurance premiums change, and property tax assessments get updated. A model built in 2024 may not reflect 2026 realities.
The California ADU rental income potential varies enough by city and neighborhood that a single statewide model is almost useless for planning purposes. Ground your projections in local comparable rents, local contractor bids, and local regulatory requirements.
One more point worth making: cap rate is a snapshot, not a forecast. It tells you what the property yields today at a given price and income level. It does not account for rent growth, appreciation, or the compounding effect of paying down a mortgage over time. For a long-term hold, those factors often matter more than the day-one cap rate.
Ready to build your California ADU with confidence?
Getting your cap rate math right starts with getting your construction cost and design right. Uni Construction specializes in permit-ready ADU design, structural engineering, and full project management across Los Angeles and Southern California. From garage conversions to detached backyard cottages, the team at Uni Construction has guided hundreds of homeowners through the design-to-permit process.
If you are ready to move from numbers on a spreadsheet to a permitted, built ADU, explore ADU design options for Los Angeles properties or browse completed ADU projects to see what is possible on properties like yours.
Key Takeaways
California ADU cap rates range from 3% to 8%, with coastal markets clustering at the lower end (3%–5%) and inland markets like Fresno reaching higher yields between 6% and 8% when construction costs are controlled.
| Point | Details |
|---|---|
| Cap rate range in California | ADU cap rates typically fall between 3% and 8%, with coastal markets like Los Angeles at 3%–5% and inland markets such as Fresno at 6%–8%, varying by city, build cost, and rental demand. |
| NOI is the foundation | Subtract vacancy, taxes, insurance, maintenance, and management fees from gross rent before dividing by property value. |
| Financing changes everything | A 4.8% cap rate property can produce a -3.4% cash-on-cash return after a 75% LTV mortgage at 6.5% interest. |
| Construction costs vary widely | Los Angeles ADU builds run $180,000 to $350,000; inland markets like Fresno start closer to $110,000. |
| ADUs lift home value | Legal ADUs in Los Angeles increase property sale prices by 20%–30% compared to similar homes without them. |